
Hwa-Jin Choi
3. Results and Summary - Seasonally distinct contributions of greenhouse gases and anthropogenic aerosols to historical changes in Arctic moisture budget 본문
3. Results and Summary - Seasonally distinct contributions of greenhouse gases and anthropogenic aerosols to historical changes in Arctic moisture budget
hjchoi0620 2024. 4. 1. 23:46Long-term trends

-
ALL : P and E show a slight decrease in the 1960-1970s due to the cooling effect of anthropogenic aerosol and, subsequently a strong increase.
-
GHG : P, E, and F (P-E) monotonically increase.
-
AER : P and E exhibit a decrease until the 1990s and then slightly increase (Tokarska et al., 2020), reflecting changes in aerosol forcing during this period.
Spatial pattern of long-term trends

-
ALL and GHG: precipitation increases in most regions.
-
Larger evaporation increases over the Barents-Kara sea due to sea-ice retreat.
-
AER : precipitation and evaporation decrease especially over the northern North Pacific.
Transport and evaporation contribution to precipitation change

-
ALL and GHG have similar seasonal variations of F and E, consistent with Bintanja et al. (2014): summer peak of transport changes, and winter-spring peak of evaporation.
-
The evaporation contribution due to sea-ice retreat is stronger in GHG than in ALL.
-
Summer: the poleward moisture flux explains 92%(75%) of precipitation changes.
-
Late autumn and winter: surface evaporation accounts for 77%(89%) of the precipitation increase.
Long-term trends in zonal averaged MMF, MMC, SE, and TE

- MMF, SE, and TE tend to increase overall in ALL and GHG. At 70°N, the contribution of moisture transport components to the increase in MMF is slightly different between ALL and GHG.
- In ALL, the change of TE is responsible for most (109%) of the MMF change at 70°N, whereas contributions of MMC and SE are -32% and 23%, respectively.
- In GHG, contributions of TE, MMC, and SE are 69%, -19%, and 50%, respectively, indicating an increased importance of SE.
Monthly changes of meridional moisture fluxes across 70°N

- Asterisks: good inter-model agreement (All models have the same sign)
- ALL and GHG: MMF increase for all months. In summer and autumn, TE is dominant for poleward moisture transport.
- In the change of TE, ALL is larger than GHG for most months.
Relations between changes in Arctic precipitation and changes in the MMF, MMC, SE and TE transport across 70°N
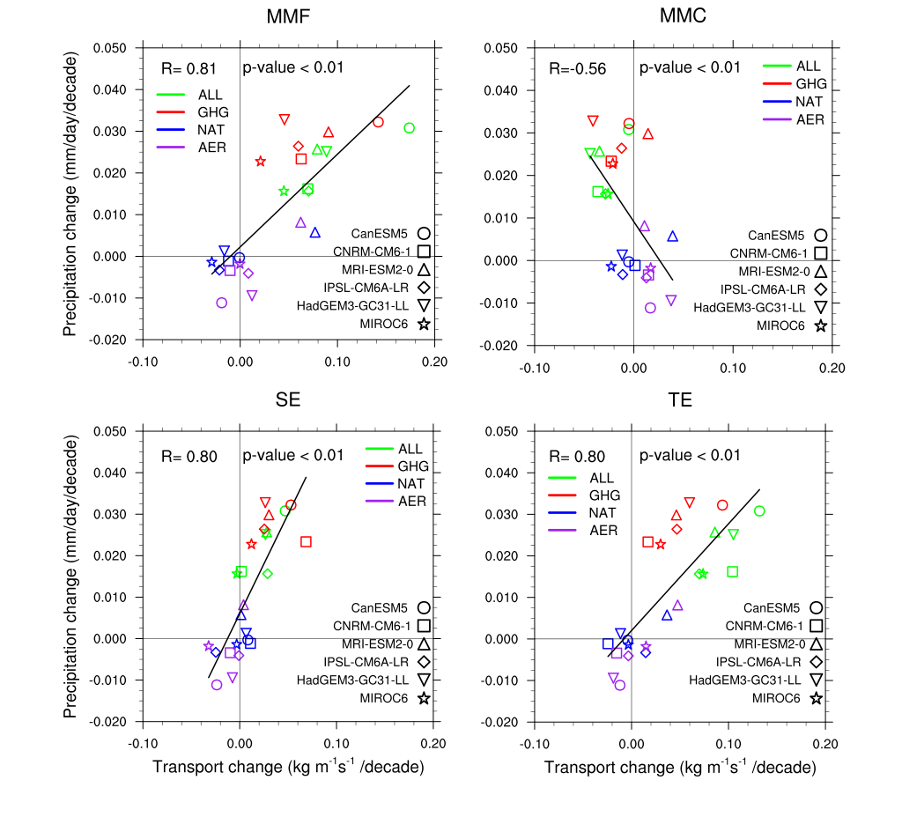
- GHG and ALL results are generally located close to each other with larger amplitudes compared to NAT and AER. This results in statistically significant linear relationships between Arctic precipitation change and changes in MMF, SE, and TE.
Spatial patterns of seasonal changes of MMF during 1960-2019

- Trends of MMF in the Arctic vary considerably across regions. Iceland and Norway have a large variability of MMF in the Atlantic sector.
- GHG runs show stronger trends than other forcings. Although ALL and GHG differ in the intensity of trends, their regional patterns are quite similar. The MMF in the Norwegian Sea increases strongly in all seasons.
- In contrast, Alaska and Northeastern Russia (120°W-120°E) in the Pacific sector have different responses according to individual forcings. In this region, there is a difference between GHG and AER, evident in autumn and winter. The poleward MMF in AER decreases in Alaska but increases in Northeastern Russia.
Regional difference of TE change across 70°N
-
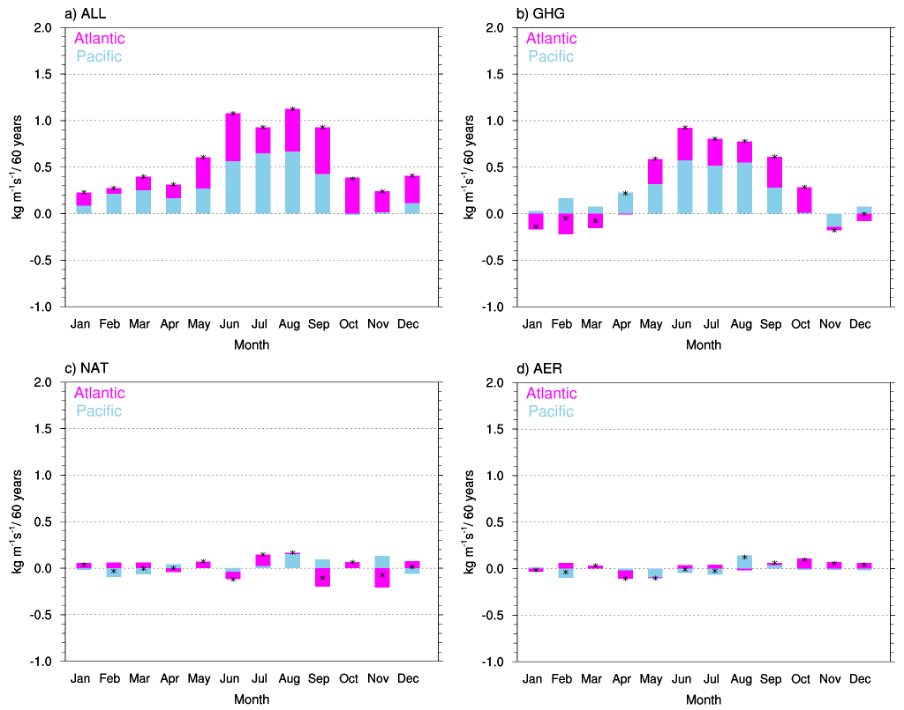
In ALL, TE increase in the Pacific sector is stronger (explaining 60% of total change) than that of the Atlantic sector during summer, but the Atlantic contribution becomes dominant during autumn (explaining 79%)
-
ALL is larger than GHG for all months.
-
In summer, GHG exhibits a weaker contribution of the Atlantic than ALL.
TE change in summer across 70°N
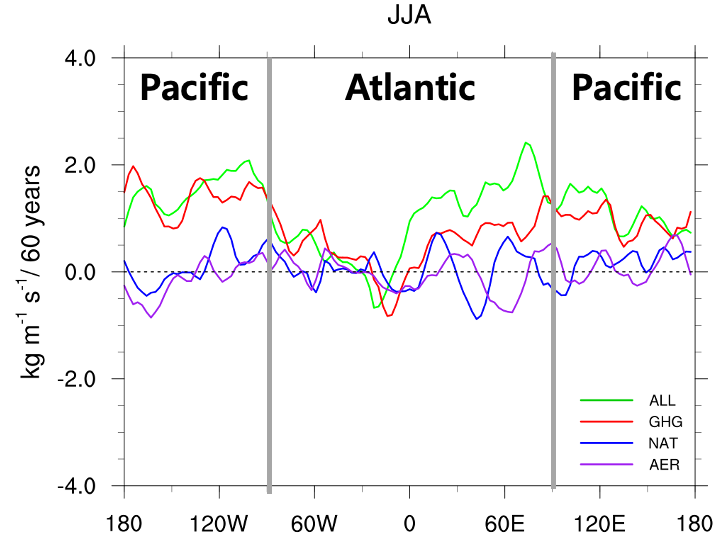
- Pacific sector: 90°E - 90°W
- Atlantic sector: 90°W - 90°E
- In summer, ALL and GHG share increases in TE over the Beaufort Sea (160°W-120°W).
- In summer, a strong TE increase over western Eurasia (0°-90°E) is observed in ALL, which explains in part a greater contribution of the Atlantic sector to the change of TE in ALL than in GHG.
Summary

We examine the past changes in Arctic moisture budget for 1960-2019 using CMIP6 historical simulations with different external forcing factors.
(1) Long-term changes in Arctic moisture budget
- Arctic precipitation and evaporation increase in ALL and GHG while they decrease in AER.
- In ALL and GHG, increases in Arctic precipitation in summer are attributed to enhanced poleward moisture inflow while the increases in winter are due to the intensified local surface evaporation in sea-ice retreat regions.
- In AER, Arctic precipitation tends to decrease during cold seasons due to reduced evaporation over sea-ice advance regions.
(2) Long-term changes in poleward moisture transport
- In summer and early autumn, TE is a main driver of the increased poleward moisture transport with weaker contributions from the MMC and SE changes in ALL and GHG.
- In ALL and GHG, MMF increased the most in summer. Because it is the summer and early autumn in which the humidity increases the most.
- In summer, the increase of TE in ALL is greater than that of GHG. This is found to be due to the greater contribution of the Atlantic sector, particularly western Eurasia, than the Pacific.
Reference
Choi, HJ., Min, SK., Yeh, SW. et al. Seasonally distinct contributions of greenhouse gases and anthropogenic aerosols to historical changes in Arctic moisture budget. npj Clim Atmos Sci 6, 189 (2023). https://doi.org/10.1038/s41612-023-00518-9

